
Upper-Ocean Thermal Structure
Real-time depth-temperature profiles derived from satellite sea surface height anomaly (SSHA), sea surface temperature (SST), and mixed-layer depth (MLD) from the Price-Weller-Pinkel (PWP) model.
Methodology
The real time ocean thermal structure (OTS) is derived from satellite SSHA and SST observations along with the MLD output from the 1D PWP mixed layer model.
The depths of the 29°C isotherm (D29) to the 4°C isotherm (D4), at 1°C intervals, are derived from satellite altimetry SSHA using linear regressions. The top layer of the OTS is the mixed layer composed of satellite SST and MLD estimated by the PWP model. SSHA uses the near real time daily 1/3° merged, gridded maps from AVISO (http://www.aviso.oceanobs.com). SST uses the real time fusion of cloud-penetrating microwave SST from Remote Sensing Systems (https://www.remss.com/).
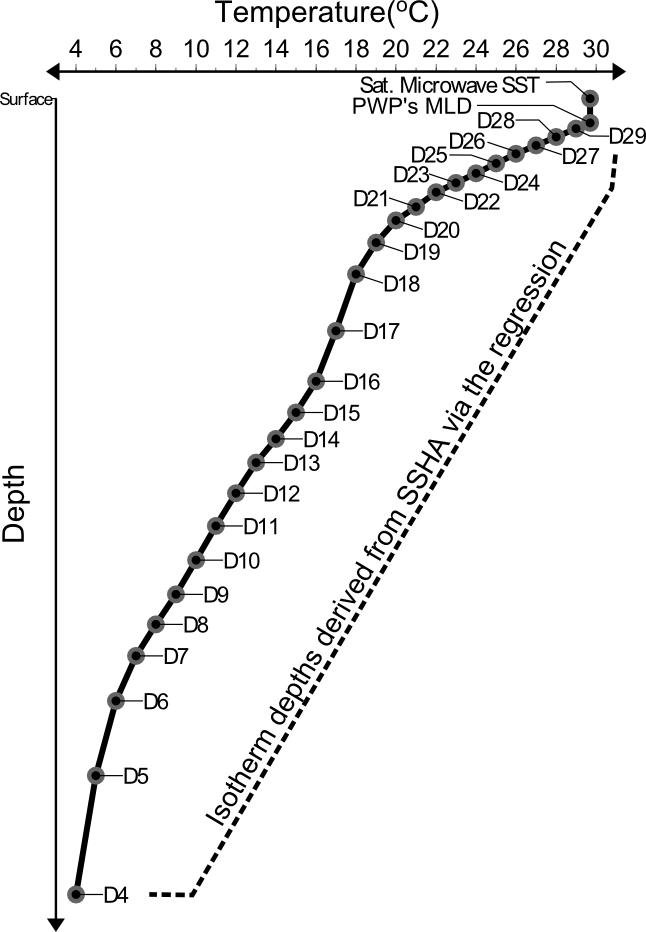
OTS schematic (replace with final figure once available).
Regression
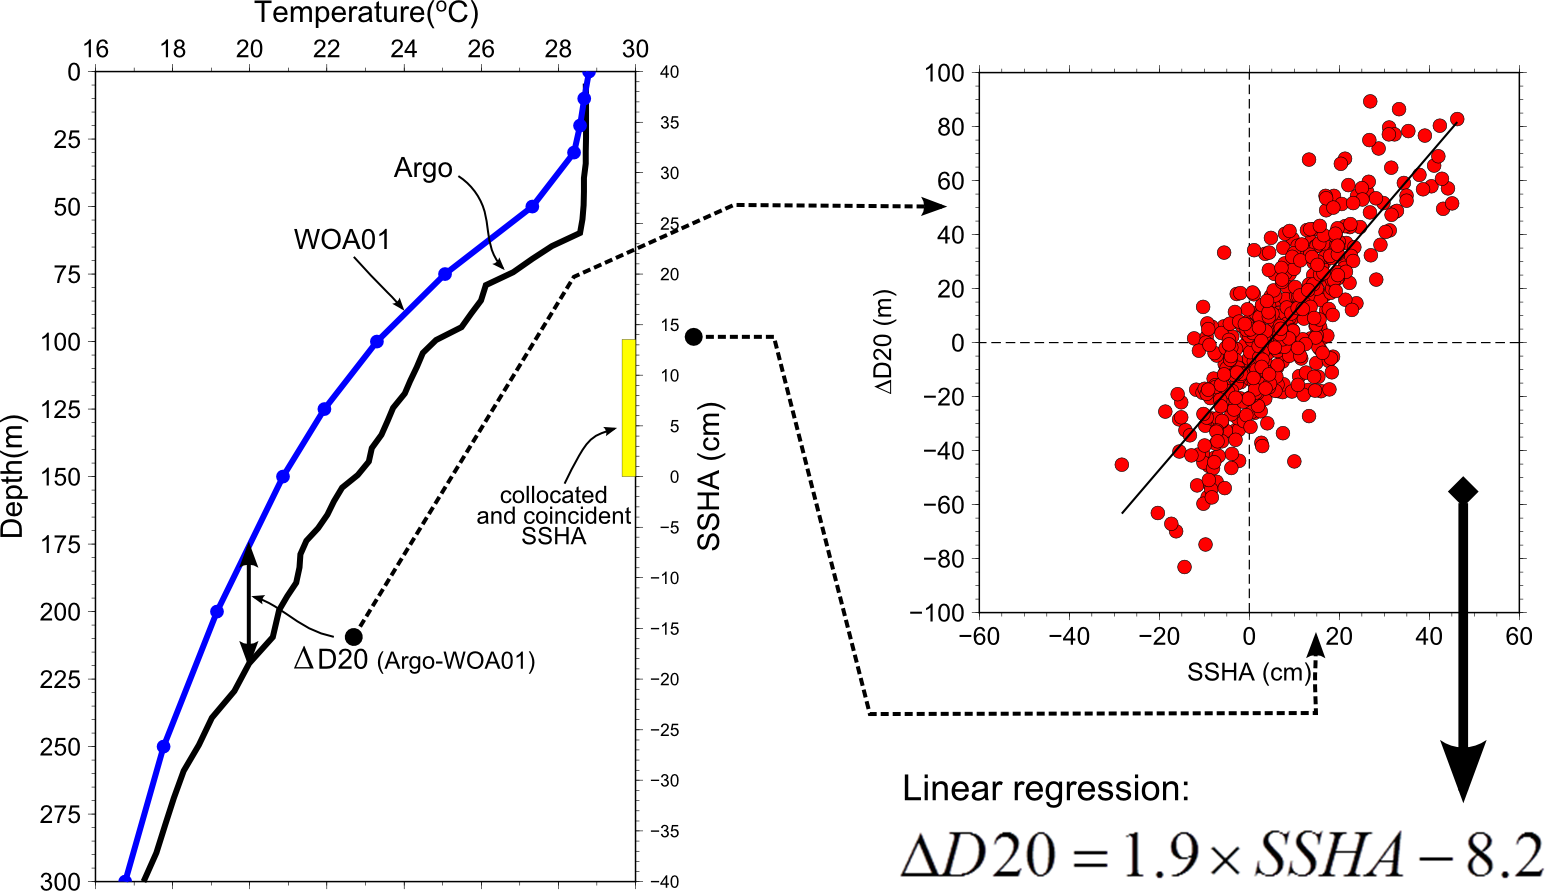
132,881 in situ temperature profiles during the hurricane season (Jun-Nov) collected from Argo (2000-2010), CTD (2000-2010) and XBT (1993-2010) are used to construct the linear regressions of SSHA onto isotherm depth variations.
Using the depth of the 20°C isotherm (D20) as an example: in situ ΔD20 is obtained by subtracting the climatological D20 (black profile on the left) from Argo in situ D20 (blue profile on the left). Collocated SSHA from altimetry (yellow bar on the left) is paired with these values. With numerous pairs of ΔD20 and SSHA (red dots on the right) within 10° longitude by 5° latitude boxes, a linear regression is developed. The regression is calculated at each 0.25° grid point and for each isotherm depth (from D29 to D4) with 1°C intervals.
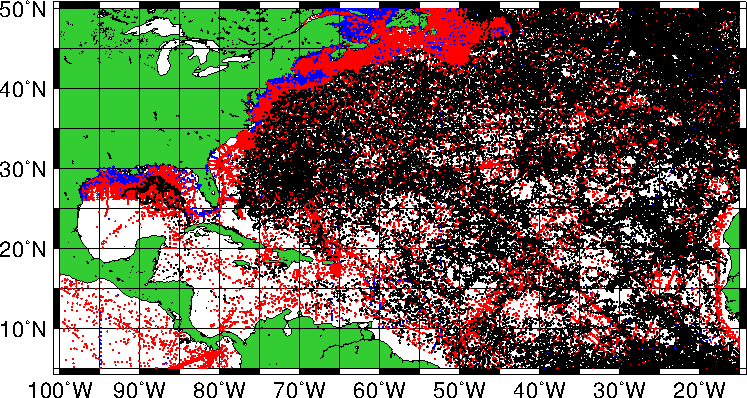
Regression training data: Argo, CTD, and XBT profiles during hurricane seasons.
Regression schematic (update with final graphic when available).
MLD from PWP
Real time daily MLD is generated by the PWP model. Climatological temperature and salinity profiles from the Generalized Digital Environmental Model (GDEM) are used as the initial condition. Wind and heat fluxes from NOGAPS are used to force the PWP model for 15 days to obtain the MLD.
Selected publications
- I.-F. Pun, I.-I. Lin, C.-R. Wu, D.-S. Ko, W.-T. Liu. Validation and application of altimetry-derived upper ocean thermal structure in the western North Pacific Ocean for typhoon intensity forecast. IEEE Trans. Geosci. Remote Sens. 45, 1616-1630 (2007).
- I.-F. Pun, I.-I. Lin, D.-S. Ko. New generation of satellite-derived ocean thermal structure for the western North Pacific typhoon intensity forecasting. Prog. Oceanogr. 121, 109-124 (2014).
- I.-F. Pun*, J. F. Price, S. R. Jayne. Satellite-Derived Ocean Thermal Structure for the North Atlantic Hurricane Season. Mon. Weather Rev. 144, 877-896 (2016).